Pricing a new product or service is one of the most daunting challenges marketers face. Marketers want to maximize value and set a price that is acceptable to as many potential customers as possible, but pricing research is fraught with peril and respondents often struggle when asked flat-out what they would be willing to pay for a product or service.
Van Westendorp’s Price Sensitivity Meter (PSM) is a research methodology that takes the guesswork out of pricing. The method was introduced by Dutch economist Peter Van Westendorp in 1976 and can be applied to any consumer product or service. The PSM establishes an acceptable consumer price range by surveying a potential market and asking respondents to answer four questions about a specific product or service:
- At what price would you consider the product to be so expensive that you would not consider buying it?
- At what price would you consider the product to be priced so low that you would feel the quality couldn’t be very good?
- At what price would you consider the product starting to get expensive, so that it is not out of the question, but you would have to give some thought to buying it?
- At what price would you consider the product to be a bargain—a great buy for the money?
Instead of requiring consumers to provide an exact price of what they would pay, the PSM questions ask respondents to provide values for a variety of value statements. The questions can be asked in a variety of ways – in-person, over the telephone, using paper surveys – but Roadmap Market Research has found online surveys to a screened panel of research participants to be the most effective approach.
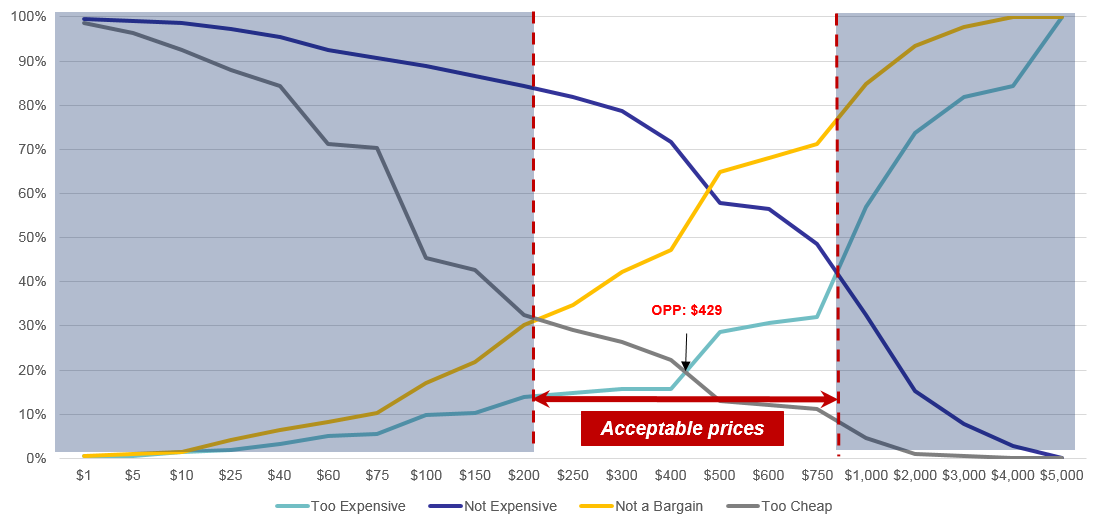
Once the sample quota has been fulfilled, the values collected for each question are plotted as histograms as shown in the example below. The histograms for “Expensive” and “Bargain” are inverted in order to create the intersections required to establish an acceptable price range. On the chart, these are referred to as “Not Expensive” and “Not a Bargain.”

Once the four histograms have been plotted, the intersections provide us with key pricing information. Analyzing the intersections are important because they give us points along the graph where there is convergence among respondents on different questions. For example, looking at the chart we can see an equal amount of respondents believe $215 is “Not a bargain” and “Too cheap.” This intersection gives us our first data point, which is the “Point of Marginal Cheapness” or POMC. The “Point of Marginal Cheapness” is the lowest amount that should be charged for the product or service being tested. Prices to the left of this boundary will cause the product to be perceived as lacking in quality.
The second key data point is the intersection of “Too Expensive” and “Too Cheap,” which gives us the “Point of Marginal Expensiveness” or POME. This is the maximum amount that should be charged for a product or service as the diverging lines to the right of this point show that the tolerance for higher prices to be extremely low among respondents. In the example above, the POME is $851. 42% of the sample believe $851 is too expensive, and 42% believe $851 is not expensive. Reading the negative space in PSM charts is key, because in this example it shows that 58% believe $851 is expensive.
Our analysis concludes that $215 to $851 is an acceptable range for our service, which is a rather wide range of prices. When we have this wide of a spread in prices, it is always useful to look at the intersection of “Too Expensive” and “Too Cheap,” or what is often referred to as the “Optimal Price Point” or OPP. The OPP is instructive as its intersection is typically in the sweet spot of the acceptable price range. In our example above, we see that the OPP of $429 is right in the middle of our range. We can also see that 80% of respondents believe a price of $429 is neither Too Expensive or Too Cheap.
The various data points the PSM reveals is one of its greatest strengths. Every study will turn out differently, and the PSM has enough indicators to allow a researcher to understand where the best pricing opportunities are.
If you are ready to implement a PSM study, Roadmap Market Research can show you how. Contact us today at info@roadmapresearch.com
